Leave a Comment
How to analyze the performance of your go application in production
Table of Contents
You should definitely use chi’s middleware for running pprof and stuff in your admin panel.
That’s the repo — https://github.com/go-chi/chi
That’s the profiler — https://github.com/go-chi/chi/blob/master/middleware/profiler.go
CPU profiling
After that you can run something like this in shell:
go tool pprof -png ~/Downloads/profile
Or just open it in the browser:
go tool pprof -http=:1234 ~/Downloads/profile
If it opens something different then your browser (sublime text in my case) in MacOS, you can generate svg file with go tool pprof -svg ~/Downloads/profile, then find it in Finder→right click→Get info→Open with… and also select «Change all…».
If you run into problems with graphviz like this Failed to execute dot. Is Graphviz installed? Error: exec: "dot": executable file not found in $PATH, just install it with brew install graphviz.
Also you can just start watching it interactively with
go tool pprof ~/Downloads/profile
Inside pprof you can run commands like top -cum or list (like list main.main).
Memory profiling
Good article on how golang app uses memory
One important thing to notice is that you should try to wait about 5 minutes after peak load to get your go application a chance to free memory as it is a little bit greedy and tries to own it for a little bit longer to avoid the overhead of asking OS for more memory in case it will need it again.
curl -X GET "http://localhost:local_port/debug/pprof/heap?debug=1" > ~/Downloads/heap_after
go tool pprof -nodefraction=0 -inuse_objects (or -inuse_space) -base ~/Downloads/heap_before <<your-app-bin-path> ~/Downloads/heap_after
While running a pprof
o - output current options
drop_negative=true - option to filter out rows with negative memory diff
granularity=lines - option to show more info on every row
top10 - show top 10 most memory consuming spots
list <go module name> - filer only usage from your project and show in more details
web - generate web version of graph.
Get profile from kubernetes
kubectl port-forward  local_port:pod_port
curl -X GET "http://localhost:local_port/debug/pprof/heap?debug=1" > ~/Downloads/heap
kubectl cp /:<your-app-bin-path> ~/Downloads
go tool pprof -nodefraction=0 -web ~/Downloads/<your-app-bin-name> ~/Downloads/heap
What else you can do about go app memory consumption
In Go, there are a few ways to do that and cause a memory leak. Most of the time they are caused by:
– Creating substrings and subslices.
– Wrong use of the defer statement.
– Unclosed HTTP response bodies (or unclosed resources in general).
– Orphaned hanging goroutines.
– Global variables.
You can check those manually, if you are a Chuck Norris ;)
More on that: https://go101.org/article/memory-leaking.html, https://www.vividcortex.com/blog/2014/01/15/two-go-memory-leaks/, https://hackernoon.com/avoiding-memory-leak-in-golang-api-1843ef45fca8.
The other issue is that there was a change in Go 1.12 regarding how the runtime signals the operating system that it can take unused memory. Before Go 1.12, the runtime sends a MADV_DONTNEED signal on unused memory and the operating system immediately reclaims the unused memory pages. Starting with Go 1.12, the signal was changed to MADV_FREE, which tells the operating system that it can reclaim some unused memory pages if it needs to, meaning it doesn’t always do that unless the system is under memory pressure from different processes. And that is an issue on k8s-like systems as there are no other apps that try to use this memory. And it looks like a memory leak on dashboards.
You can force go runtime to use old signal this way, if you really want to - GODEBUG=madvdontneed=1.
More on that here - https://blog.detectify.com/2019/09/05/how-we-tracked-down-a-memory-leak-in-one-of-our-go-microservices/.
Starting from go1.16 they returned back to `MADV_DONTNEED` by default.
You can also free memory (for debugging purposes) with a code like that:
func init() {
   go func() {
       t := time.Tick(time.Second)
       for {
           <-t
           debug.FreeOSMemory()
       }
   }()
}
More on that (and other interesting things in a thread) - https://stackoverflow.com/questions/24863164/how-to-analyze-golang-memory.
You can check GC params starting app with this ENV param set GODEBUG=gctrace=1.
More details - https://github.com/golang/go/wiki/Performance#garbage-collector-trace. This article also has a lot of information on memory model in golang.
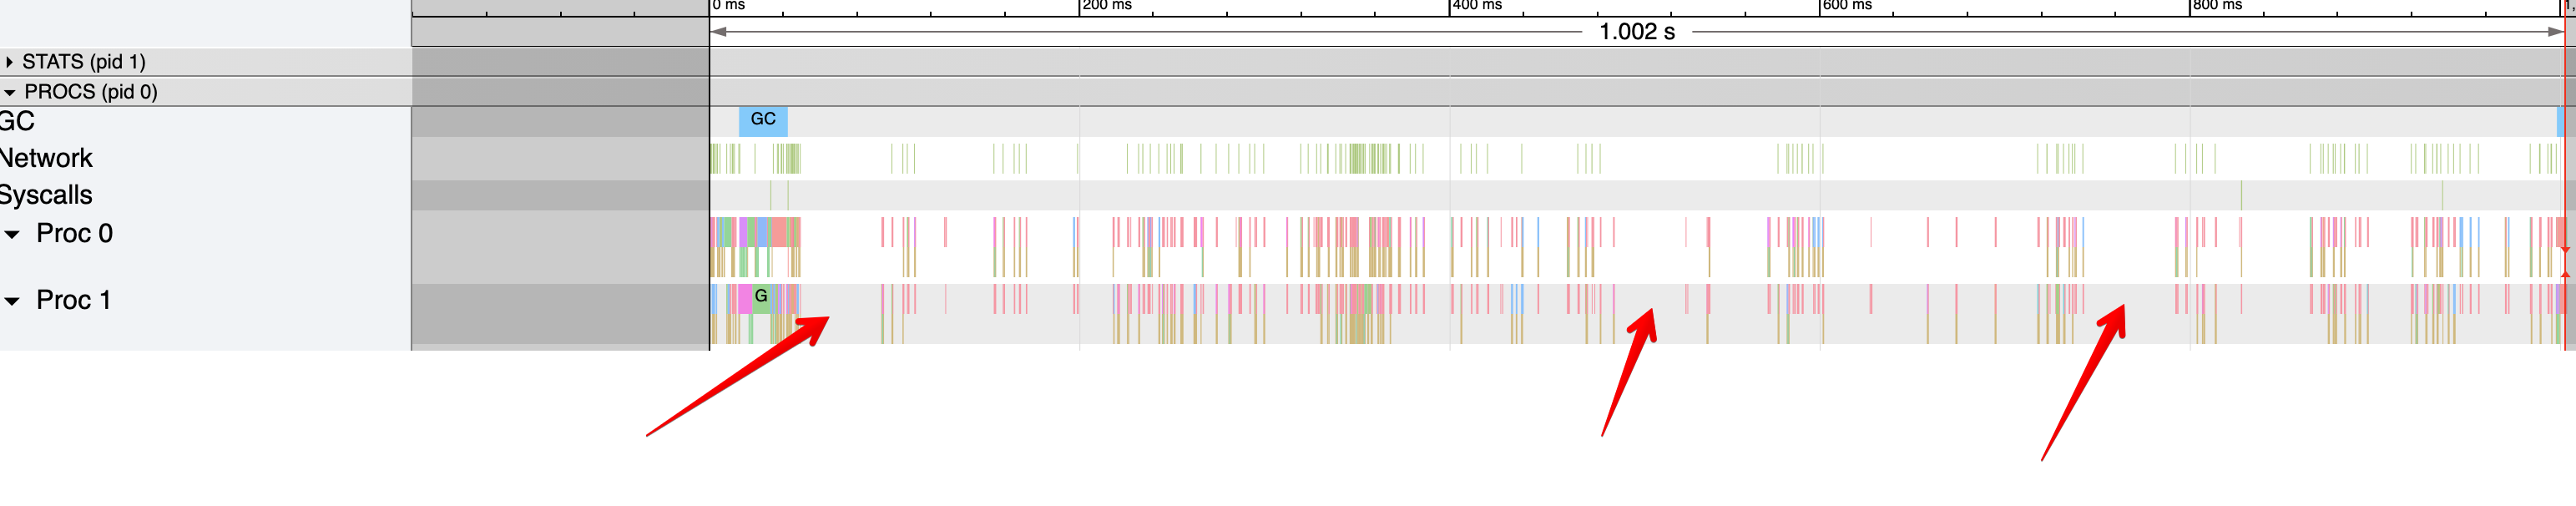
Trace profiling
Trace profiles can be watched by
go tool trace ~/Downloads/trace
You will see something like that
There is a nice video on that:
https://www.youtube.com/watch?v=ySy3sR1LFCQ
LEAVE A COMMENT
Для отправки комментария вам необходимо авторизоваться.